Understanding Errors and Distortion in Remote Sensing of Environments

The old saying “garbage in, garbage out” is true of many situations, and in remote sensing of environments, it’s spot on. The insight you gain from a data set is only as good as the data you source.
Distortion in aerial photography or metadata inconsistencies can botch results, impacting project cost, deadlines, and even safety. When estimating vegetation growth for fire prevention or tracking hillside erosion in residential areas, for example, remote sensing accuracy can become a matter of life and death.
Accurate data from remote sensing technology is fuel for process automation, 3D immersive mapping, advanced security, and much more. But how do you detect errors and distortions that can undermine data integrity?
Understanding Resolution
To understand how errors happen in remote sensing of environments, we need to understand the factors at play in generating data.
Photogrammetry relies on high-resolution images to quantify measurements and form 3D models of buildings, infrastructure, property, and more. This aerial photography involves different forms of data resolution that expand on our general understanding of picture quality. Resolution in photogrammetric data comes in three distinct forms:
1. Spatial Resolution
Spatial resolution describes the area and detail of the smallest feature detectable via a remote sensing device. It’s usually described by a single value representing the length of one side of a square pixel. In other words, a spatial resolution of 100m means that one pixel represents an area of 1,000 square meters on the ground.
The finer the spatial resolution, the more precise the data in each pixel—and the more refined your spatial analysis can be.
2. Spectral Resolution
Light and color can be valuable indicators of on-the-ground conditions or infuriating sources of errors and distortions. It all depends on how accurately you document them.
Spectral resolution describes the capacity of a sensor to document electromagnetic wavelengths including color, infrared light, and more. The finer the spectral resolution, the narrower the range a sensor can document.
Color and shadow matter for most projects, but they are especially important for satellite-mounted technology. Extra layers of atmosphere can become sources of geometric distortions in remote sensing.
3. Temporal Resolution
When too much time passes between two data sets, you lose the continuity necessary to draw solid conclusions. This loss of continuity stems directly from poor temporal resolution. The older data sets may also no longer meet accuracy and precision requirements for spatial or spectral resolution, creating inconsistencies and clouding results.
Thankfully, new UAV-mounted remote sensing devices make it affordable to collect data and improve temporal resolution on data sets.
Dealing with Image Distortion
What can you do when remote-sensing images don’t turn out right? First, understand a few additional factors at play, then use trusted measures to account for the distortion and obtain more accurate images.
Geometric Distortion in Imagery
Geometric distortion is a warping of the image that distorts spatial relationships. The problem is that it can impact spatial measurement accuracy, appearing to change the size, shape, and space among and between objects.
Remote sensing images are inherently susceptible to geometric distortion because they attempt to capture and represent 3D surfaces as 2D images. Variations in platform stability during data acquisition—including changes in speed, altitude, and attitude—all play roles. But distortions happen for a variety of other reasons, including
- Sensor optics perspective
- Scanning system motion
- Earth’s curvature and rotation
- Terrain relief
Distortion Removal
Fixing distortions—or orthorectification—can be as simple as leveraging computer technology. Computers look at new images compared to various ground control points, or snippets of images focused on features with known latitude, longitude, and elevation. Matching the features present in both new images and control points, the computers can resize and rotate the new images to provide an accurate view.
Orthomosaics
What if you could approach imagery as a puzzle? An orthomosaic is a large map made up of smaller orthophotos, or photos normalized to provide a top-down view.
What’s unique is that each photo is associated with a specific geographic position. Mapping software then uses geographic data to put the images together, but each must have 70 percent overlap to create an accurate picture. The photos also have to be normalized to account for:
- Altitude
- Lens distortion
- Camera tilt
- Environmental conditions
Afterward, all images can come together as a 2D orthomosaic that is useful for measuring topography, buildings, materials, and more.
Avoiding Errors in Remote Sensing
Errors in remote sensing of environments can be costly. To reduce distortion and other accuracy issues, consider the following factors.
Atmospheric Conditions
Changes in the atmosphere, sun illumination, and viewing geometries during image capture can impact data accuracy, resulting in distortions that hinder automated information extraction and change detection processes. Errors and distortion are often caused by:
- Humidity
- Water vapor
- Light
When atmospheric conditions change, reference points can be obscured or lost, impacting efforts to create accurate measurements from images. For instance, differences in light temperature lead to color changes, distorting data quality and creating unsightly inconsistencies that ruin the magic of 3D maps.
Altitude and Reflectance
Light collected at high elevation goes through a larger column of air before it reaches the sensor. The result is surface reflectance, a phenomenon that can diminish color quality and detail in images.
The difference in reflectance near the surface and at top-of-atmosphere creates substantial changes in color, image resolution, and perspective. These changes may need to be accounted for in normalization. Even on a small scale, altitude variances between data sets should raise a red flag for cross-referencing and review.
Documented Metadata for Cross-Referencing
Data errors come from sources that are difficult to pinpoint—momentary glitches in connectivity, inconsistencies in light, or other atmospheric distortions in remote sensing of environments. Unfortunately, the sources of errors in geographic information systems (GIS) aren’t always immediately apparent.
Metadata is data that describes data—or in this case, characteristics of the collected GIS data. In photogrammetry, metadata could include:
- GPS location
- Focal length and resolution settings
- Altitude
- Time and date
- Atmospheric conditions
- And more
Metadata should tell you who made the data, provide context for the data, and help determine if the data is appropriate for your project. This information offers insight for researchers and engineers on the conditions under which a data set was created and often the value it creates for a project. Avoid using data sets with incomplete or inconsistent metadata because it could cause erroneous results.
False accuracy is a problem, but regularly layering and cross-referencing data sets against existing data to pinpoint errors and ensure accuracy are good data practices to turn into habits. Always check your metadata when cross-referencing.
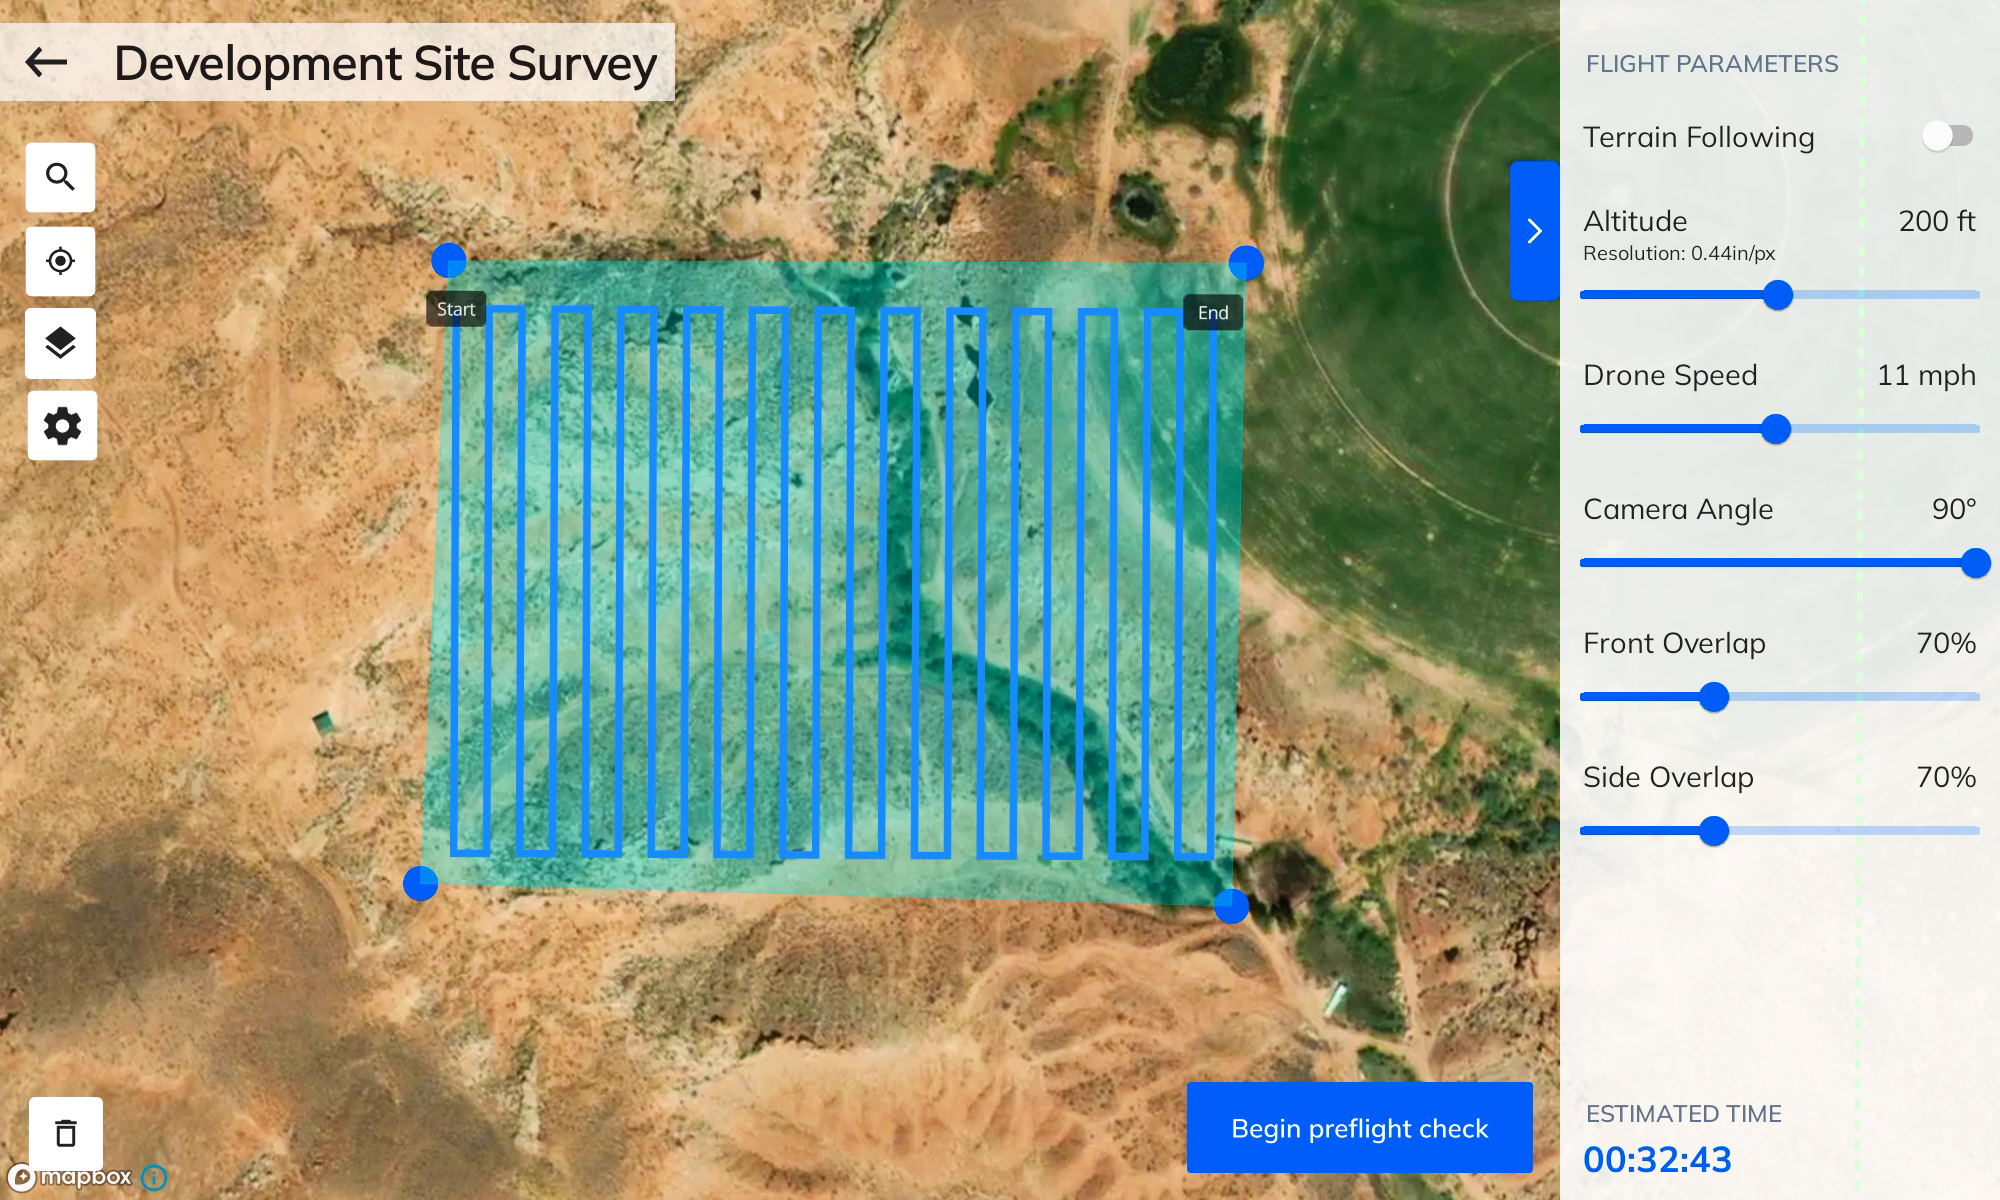
Control Over the Flight Path
Photogrammetry relies on the stability of several factors to produce accurate and precise results. Unfortunately, some of the biggest tools used in remote sensing of environments are also the least reliable. Airplanes and helicopters are traditionally used in aerial photography. However, both are susceptible to changes in weather and wind speed, not to mention human error. This makes them unreliable for generating bulletproof data sets for advanced mapping software.
Thankfully, UAV technology offers increased control over flight paths. Drones can also fill the temporal resolution gap by flying frequent tours for less than a single manned flight.
Gaining New Reliability with Photogrammetry Software
Leveraging a data-processing solution that ensures up-to-date, reliable data is vital for project success. Aerial’s new Mapware photogrammetry software generates bigger, better 3D maps in the cloud, so you can access them from anywhere. Whether you want to map a single building, a dozen cell towers, or an entire city, this software is backed by an expert team to create value for your project.

This article, originally posted on June 4, 2020, was updated June 15, 2023.

